


The Simple Guide on simulated Trading Financial Markets
Price Action
What is Price Action Trading?
Price action is simply the act of simulated trading based on the market movements or money flow from price movements alone.
To trade price action you are simply looking at price!
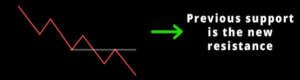
We look at how price is responding to key levels of Support/Resistance and how price is responding to buyers/sellers.
Every chart pattern and candlestick pattern comes under price action.
In price action, price position is one of the most important things.
Where you see pattern formation and chart patters like in the middle of the trend, at the break of any level or at support, etc.
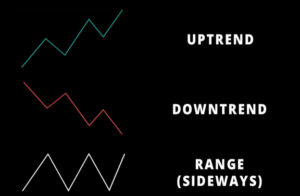
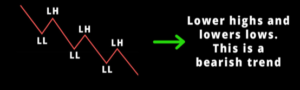
First fundamental things to understand is the direction of the market whether market is in an uptrend, downtrend, or sideways.
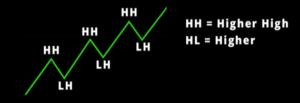
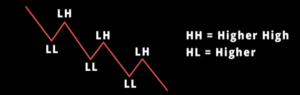
Market Structure
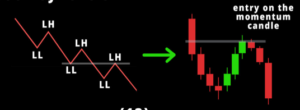
When price is trending, it creates certain highs and lows. By paying attention to the highs and lows we can identify the trend and find key levels.
Uptrend
Downtrend
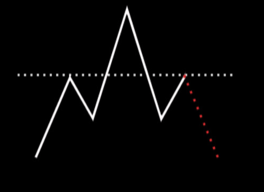
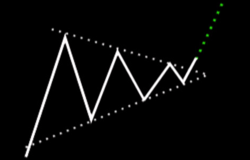
When market comes to certain levels, we see some common behavior in price. These behaviors result in patterns called “chart patterns”.
There are various patterns like double top/bottom, Wedges, Head and Shoulders, Flags and etc.
For Example:
Head and Shoulders
Symmetrical Triangle
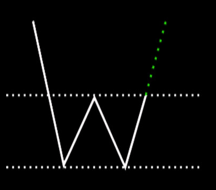
Double Bottom
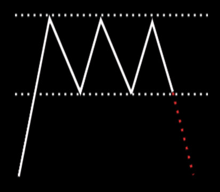
Triple Top
These pattern are imbalances between buyers and sellers out there. We should never trade solely on patterns!
Note: These are textbook examples. Real market conditions are always a bit different so spotting these patterns can be difficult.
Candlestick Analysis
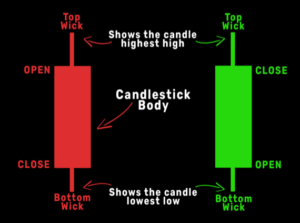
This is How You Read Candles
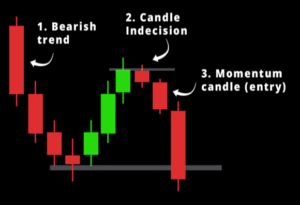
In order to enter the trade and analyze the candles you need to first analyze its behavior.
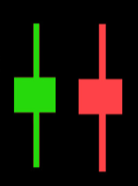
Generally, there are 3 types of candles.
Momentum Candle
This is your entry candle. This candle shows strong momentum in your trade direction.
Indecision Candle
This candle shows weakness in a trend. There is an indecision between bulls and bears. We don’t have any clear direction.
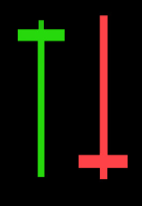
Wick Rejection Candles
The “Wick Rejection Candles” show us that it is failing to break a level and price is likely to continue/reverse. More wick rejections equal higher chance of reversal.
These 3 types of candles form various types of candlestick patterns like the engulfing candle, tweezers, piercing and more..
This is how you should analyze candlestick behavior:
Trading Edge
Edge is one of the most important things in trading.
It means having cash generating advantage over others in the market. You need to create a simulated trading strategy and a plan which has a good win rate over a series of trades. Most importantly you have to be disciplined in the market!
Every edge we have as technical traders comes from an imbalance of buying and selling pressure. If we realize this and if we limit our involvement in the market to those points where there is an actual imbalance, then there is the possibility of making virtual profit..
We can sometimes identify these imbalances through the patterns they create in prices, and these patterns can provide us information that we can use to execute trades.
We DO NOT trade patterns in markets, we trade the underlying imbalances that create those patterns.
How to Find Your Edge in the Market
This is not something you do one time and it’s not something that comes straight away.
It is a process of progressing and finding what works for you. A lot of work will be put into tweaking your strategy and mastering your craft.
It is necessary to monitor ongoing performance as markets evolve as your experience grows. Committing to this process is important!
Ready to find your edge in the market? Take our Challenge: CLICK HERE
Trade Setup Example
This is an easy setup that you can implement on most timeframes!
Identify Market Structure
Mark Out Key Levels
Analyze the Candlesticks at those Key Levels
Risk Management
Risk Management and Why it is Important
Risk management is there for us to protect our capital from big losses. It plays a very important role in trading. It helps us to stay in the game in the long run.
Risk management is different for every segment like equities, options, forex, etc. It also changes if you are simulated trading with margin and just in general different strategy or risk tolerance affects the way you would manage your risk. So in a way, risk management is personal.
Now, we will understand some basic and the most important concept of risk management.
Stoploss
Stop loss is very important in trading. It is the point where you exit your trade if the market doesn’t go in your favor. Successful traders always pre determine their stop loss before executing any trade.
Risk to Reward
Risk to Reward is used so that our virtual profits are always greater than our losses. Its the ratio between your stop loss and take virtual profit target. For example, if your stop loss is 10 pips and target is 20 pips your risk to reward is (one to two) 1:2RR
Position Sizing
Position Sizing is used to determine how many units of currency you can purchase. Position size is determined based on how big your account size is. Bigger accounts can handle bigger positions.
2-3% Risk Rule
This is a well known concept, the idea is to not risk more than 2-3% per trade so that you can preserve capital in the long run and not have gig losses from singular trades.
Example:
If you have $10,000 capital you should not be risking more than $300. Anything above that would be more than 3%.
Let’s assume your stop loss in a trade is 20 pips and you are risking $300. Then your position size will be:

Your Risk Will Always Change
If that $10,000 account grows to $11,000 your risk will now change too. This time if you want to risk 3% it will now be $330. Same rule applies if your account value decreases.
Remember to always manage risk since that is the only thing we can truly control as traders.
Profits are impossible to predict so as long as your risk stays small and your wins stay big you will virtual profit in the long run.
Trading Psychology
The most important thing in simulated trading is by far simulated trading psychology.
90% of traders fail in the simulated trading only because they lack the emotional control, discipline and patience. If you master these things it will not only improve your simulated trading but also you as a person.
Trading the financial markets involves putting your money on the line. For beginner to intermediate traders it is difficult to cope with losses and difficult holding on to trades due to the emotions taking control.
It is the main road block that traders come across after learning technicals and fundamentals. Psychology is the main key to success in trading.
Greed, fear, hope, euphoria, and panic among others are the range of emotional biases that every trader comes across while trading. To be a successful trader, we need to keep these emotions in check.
We can’t completely avoid these emotions but we have to keep them in control.
How to Improve your Psychology
One simple thing I would like to tell you is: Plan the trade and trade the plan.
It sounds easy and simple but not many people do this and actually follow it. Creating a plan is easy but to follow it with discipline is very hard.
Why is hard to follow?
It’s because your lack of patience, greed, fear, euphoria, and many more emotions running through your mind while trading.
How to Overcome these Situations
Just remember there is a great deal of randomness in markets. We can do everything right and still end up in a losing trade.
Hence why a trader should care only about having a method with a positive expectancy (Edge) and work on being profitable over the long term.
You have to identify your weaknesses and work to change. Keep a simulated trading diary. Write down your reasons for entering and exiting. Write down your thoughts before and after the trade and come up with improvements you could make, even if the trade was profitable.
Look for repetitive patterns for success and failure (both psychologically and technically). Make sure you don’t repeat your mistakes.
Keep your goals for long term and not for short term. Don’t get depressed after losing a trade and don’t get too excited after winning a trade. No strategy in this world has a 100 % win rate.
Trading is a business and like any other business we are not losing, we are occurring expenses.
There is absolutely no connection between the outcome of two trades even though if they looked identical. This is why risk management is considered more important than technical analysis as even the best setup in the world could experience losing days or weeks.
Trading is just a numbers game.
Trading Plan
How to Build a simulated Trading Plan
Everyone’s plan is different. These are some basic things you must have in your plan.
(For more information about Swing Trading, CLICK HERE)
What time will you trade?
When will you trade? What session will you focus on? Pre define your simulated trading hours, it’s not healthy to trade all day.
What markets will you trade?
What markets or pairs will you focus on? Pick 1-2 pairs especially if you are a beginner.
What is your style of trading?
Will you be focusing on scalping the market or look for swing positions to run through the week? This will also determine the TF you should focus on.
What setups will you take?
Write down the setups you will be looking for. Anything not mentioned should be avoided, even if it looks good.
Write down your entry/exit rules
When and where will you enter or exit. Write down your entry/exit criteria for both of the outcomes.
Risk Management Plan
What is your max risk per day and per trade? How will you manage your positions to reduce risk?
Feel free to add as much as you want! Remember that your plan means nothing if you don’t follow it religiously!