


As you get into Forex trading, one of the key fundamentals you’ll need to learn is price action trading. Simply put, this is a way of analyzing the market to decide whether to buy, sell, or hold an asset.
The term “price action” refers to the price fluctuations of a Forex pair. Basically, the price action reflects the collective market sentiment. When you analyze the price movements, you’ll be able to understand who’s in control: the buyers or the sellers.
Price action trading analyzes price movements and patterns to predict the market. It relies solely on technical indicators to gauge patterns and trends and find potential trading opportunities. It typically doesn’t take fundamental aspects or external factors into account.
Let’s learn more about how price action trading can be a powerful strategy and how you can best use it.

Understanding Price Action Trading
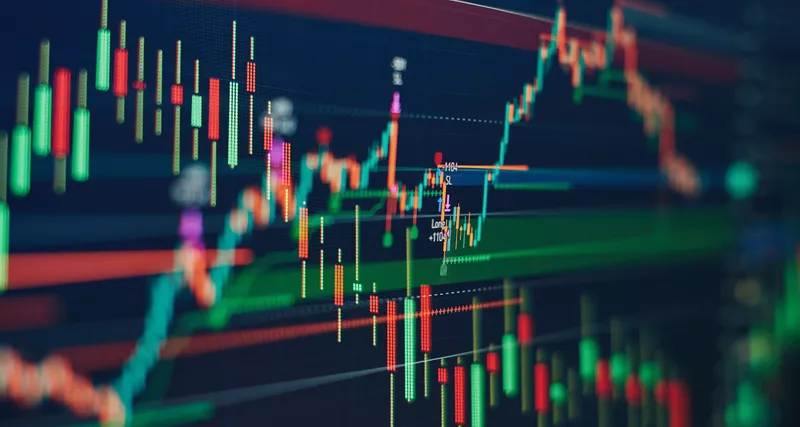
Price action trading is a dynamic and highly effective approach. Price action traders will study the raw price movements on a chart without relying much on fundamental analysis. Instead, they focus on understanding candlestick patterns, support and resistance levels, and trend lines to make informed trading decisions.
Here’s a breakdown of the key elements in price action trading:
Candlestick Patterns
Understanding candlestick patterns is a crucial part of price action trading. They offer valuable insights into market sentiment and potential reversals. By looking at the arrangement of candlesticks on price charts, you can better tell if a trend is bullish or bearish.
Bullish Candlestick Patterns
- Bullish Engulfing Candle: This pattern occurs when a large bullish candle fully engulfs the previous bearish candle. It often signals a potential upward reversal.
- Hammer: This is a single candlestick with a small body and a long lower wick, resembling a hammer. This suggests that buyers are gaining control.
Bearish Candlestick Patterns
- Bearish Engulfing Candle: This pattern forms when a large bearish candle engulfs the prior bullish candle, indicating a potential downward reversal.
- Shooting Star: A shooting star has a small body with a long upper wick. It signals potential weakness in the market and a shift toward bearish sentiment.
Continuation Patterns
- Bullish Flag: This pattern resembles a flagpole and a flag. It usually signals a temporary consolidation before the continuation of an uptrend.
Trend Lines
A trend line is a line drawn to connect two or more significant price points on the chart. This helps traders visualize and analyze the prevailing trend. Specifically, is it an uptrend, downtrend, or sideways?
To draw trend lines, you’ll need to identify at least two points on the chart where the price changes direction. For example, in an uptrend, you can connect two or more higher lows. In a downtrend, you can connect lower highs. These lines will help you understand the support and resistance level of the trend. Price action traders usually buy near the support trend line in an uptrend and sell near the resistance trend line in a downtrend.
Identifying Support and Resistance Levels
Support and resistance are an essential part of price action trading. They signify the levels at which a currency pair tends to stall, reverse, or change direction.
- Support is at a level where the demand is strong enough to prevent further decline. The support line acts as a “floor,” which prevents prices from falling lower. This means the price keeps bouncing back up from the support level and makes it a buy indicator.
- Resistance is the opposite. It’s a level where the supply outweighs demand. This prevents the price from moving further up. The resistance line acts as a “ceiling.” The price usually bounces back down from here, which makes it a potential selling opportunity.
Use support and resistance levels to set entry and exit points, place stop-loss orders, and determine risk-reward ratios. However, you should always combine it with other technical indicators for comprehensive analysis.
To make the best use of all these indicators, you must start thinking in probabilities. Trading probabilities means accepting that each trade is unique and that there are always unknown forces driving the market. Simply put, despite your technical analysis, the trade may not go your way. So, you’ll need to cultivate a probabilistic mindset and focus on long-term gains.

Relevance of Price Action Trading in Forex
Because trading occurs across multiple time zones and locations, the Forex market operates 24 hours a day. There’s no centralized exchange monitoring the trades. This means prices can fluctuate at any time based on the market sentiment. Price action trading thrives in this environment, as it focuses solely on price movements.
This strategy is frequently used by swing traders and trend traders alike. Instead of fundamental analysis, they focus entirely on the support and resistance lines to look for breakouts and consolidation. It also helps pinpoint key entry and exit points, set stop-loss orders, determine profit targets, and manage risk.
In addition, analyzing price action can tell you a lot about the underlying psychology driving those movements. This can help you anticipate the strength and direction of the trend and adjust your strategy accordingly. It’s important to pay attention to candlestick patterns for clues about potential breakouts and reversals.
You should also follow the trading volume. A low trading volume indicates a weak trend.
Price Action: The Essence of Technical Analysis
Price action trading can be a strategy in itself. But it can also serve as the bedrock of different trading strategies. Specifically, it forms the foundation upon which different technical tools and indicators are built. It’s like a common thread that weaves through various trading strategies.
Here are some prominent price action strategies to know:
Price Action for Swing Trading
Opt for an appropriate time frame that aligns with your swing trading approach, such as daily or four-hour charts. Next, identify the trend by examining candlestick patterns. Look for higher highs and higher lows to spot an uptrend, or lower highs and lower lows for a downtrend. These will give you potential swing points where prices are likely to reverse.
Price Action for Scalping
Scalping trades happen quickly, often within a few minutes or less. Scalpers take profit at around five to 10 pips. They don’t look at fundamental analysis and instead focus solely on price movement. To scalp, use a one-minute chart and look for engulfing patterns. These can indicate entry and exit points.
Trading Shooting Stars and Hammers
A hammer shows up when sellers try to push the price down but buyers bring it back up. This means the buying sentiment is stronger, which causes the market to rally. To trade a hammer, enter when the price breaks the high of the hammer candle. Then, use a trailing stop loss to exit favorably.
A shooting star is the opposite of a hammer pattern. In this case, enter the trade when the market breaks the low of the shooting star candle.
Trade Price Action With The Funded Trader
To master price action trading, you must observe and understand different kinds of candlestick patterns. Know how to accurately plot support and resistance levels as well.
What’s more, always use proper risk management with stop-loss orders and profit targets. You should also consider maintaining a trading journal to record and assess your trades.
Ready to test your price action trading strategy? Join The Funded Trader’s Challenge today to start building your wealth.